Real dashboards. Real accounts. No cherry-picked stats.
Every screenshot below is pulled directly from a live client account. Campaign names blurred to protect confidentiality — the numbers are untouched.
Skincare brand — 3-month scale, ROAS improving alongside revenue.
From ₹8.2L to ₹17.47L a month in 3 months — with ROAS climbing from 2.5X to 3.8X over the same period. Growth here came mostly from efficiency, not just more traffic: sessions barely moved while revenue more than doubled.
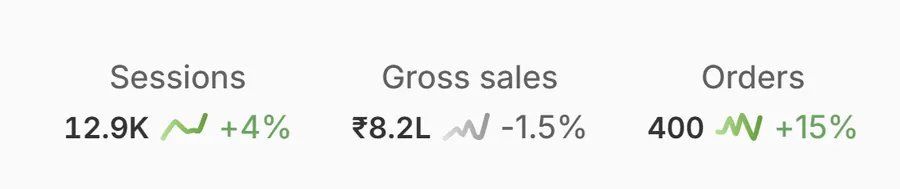
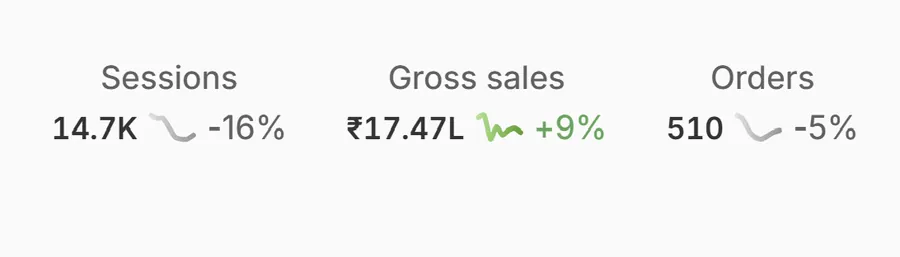
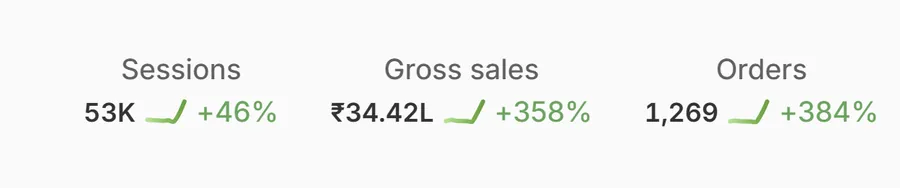
Clothing brand — August (full month) vs. September (first 20 days)
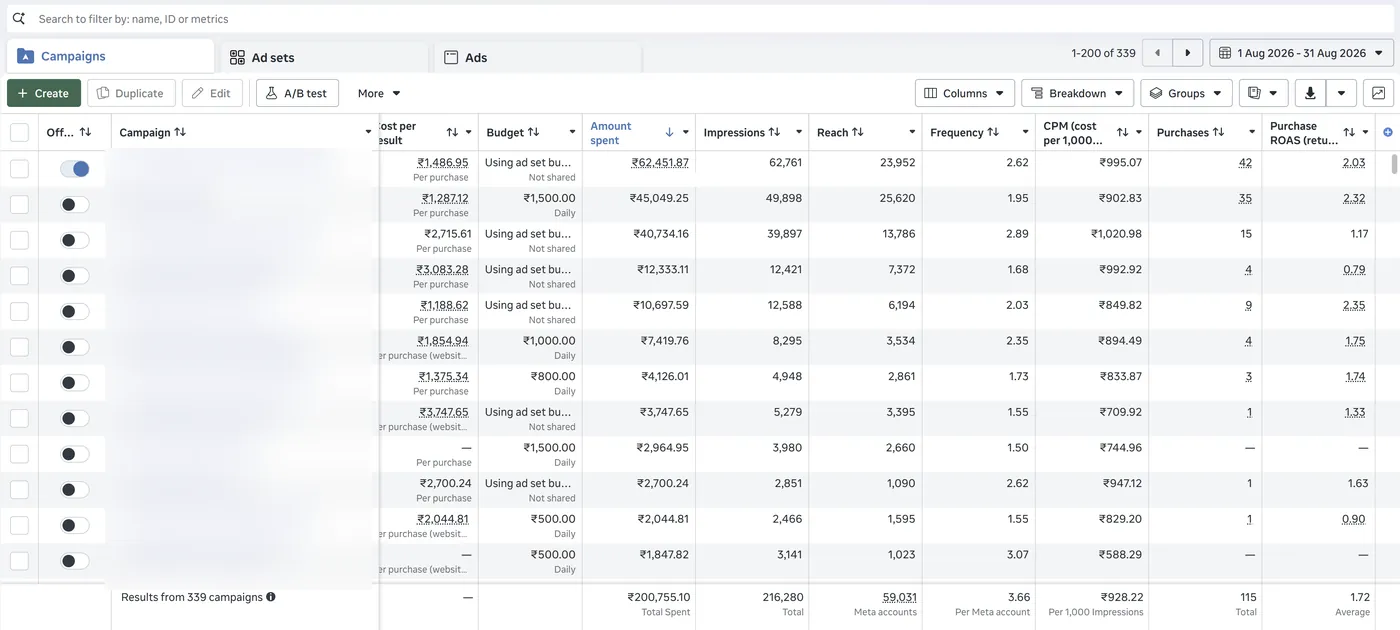
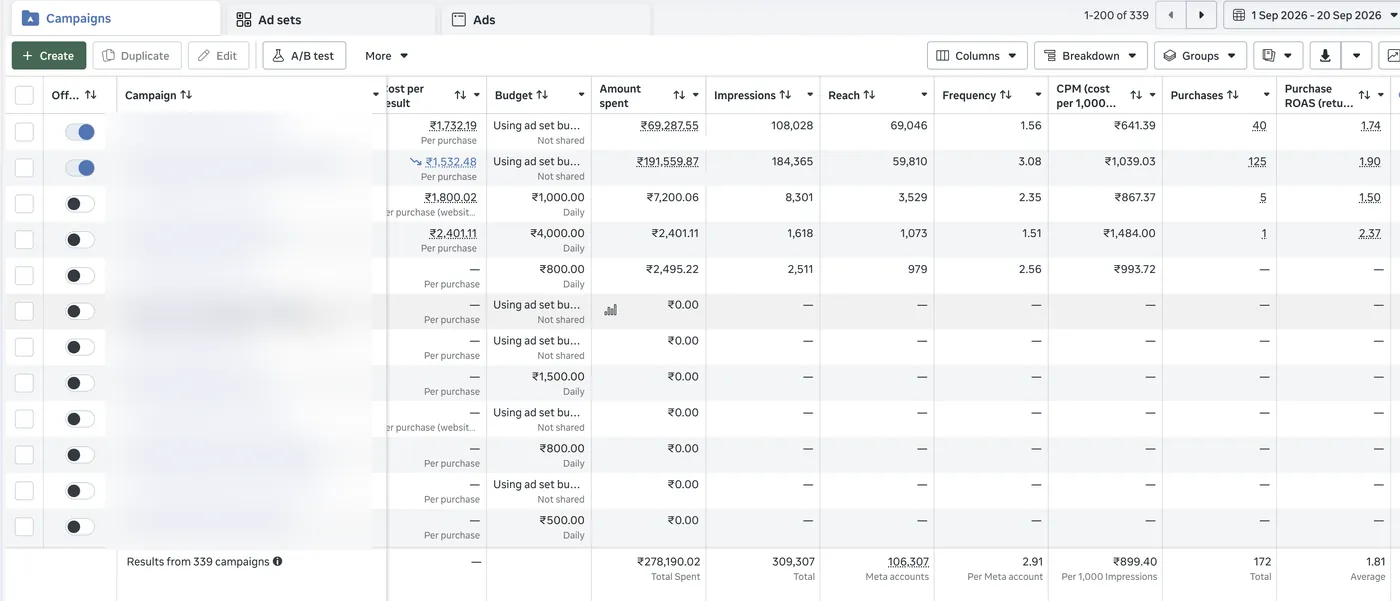
Same account. In August, the ad account was running dozens of overlapping test campaigns. In September, we consolidated down to 2 active campaigns — and the daily run-rate on both revenue and orders more than doubled, while ROAS held steady and even improved slightly.


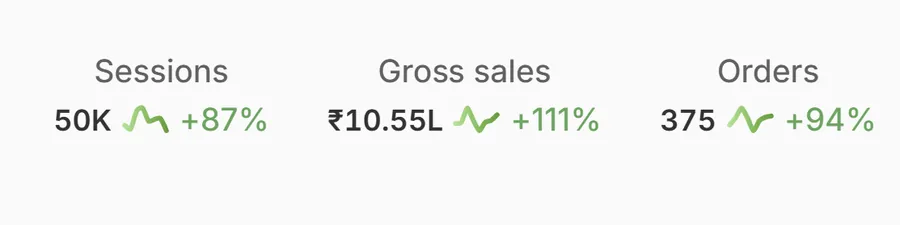
Men's apparel brand — July vs. September 2026
Three months of rigorous creative testing to find real winners. Meta ROAS was still soft in July — by September, the account's blended ROAS had climbed to over 8X, with sales and orders growing far faster than traffic.
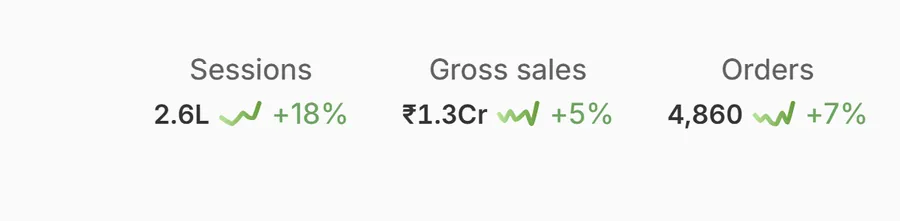
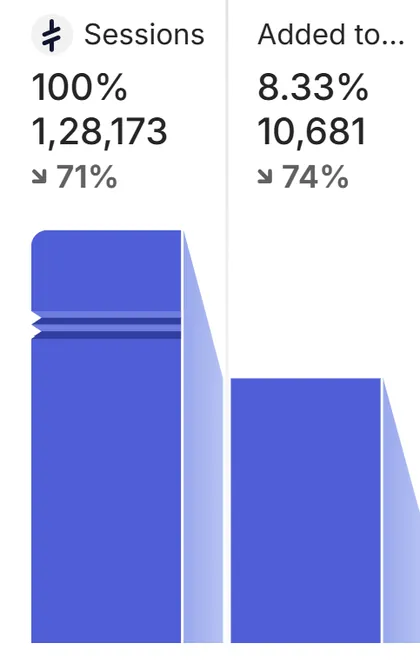
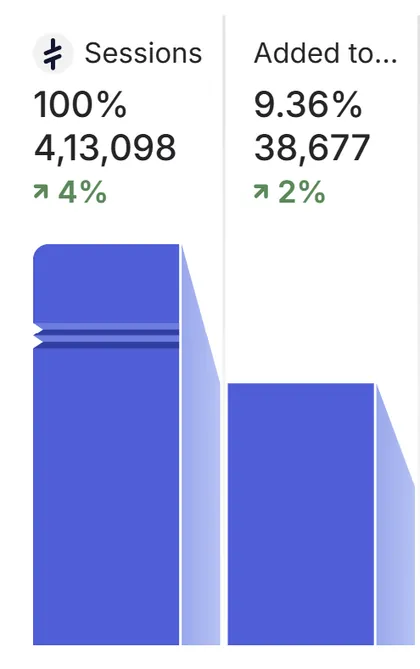
Plus-size women's clothing brand — 6-month scaling story, February vs. July 2026
Not a quick win — a sustained 6-month build. Traffic, orders, and revenue all roughly doubled, and the funnel got more efficient at the same time: add-to-cart rate improved alongside the scale, not despite it.

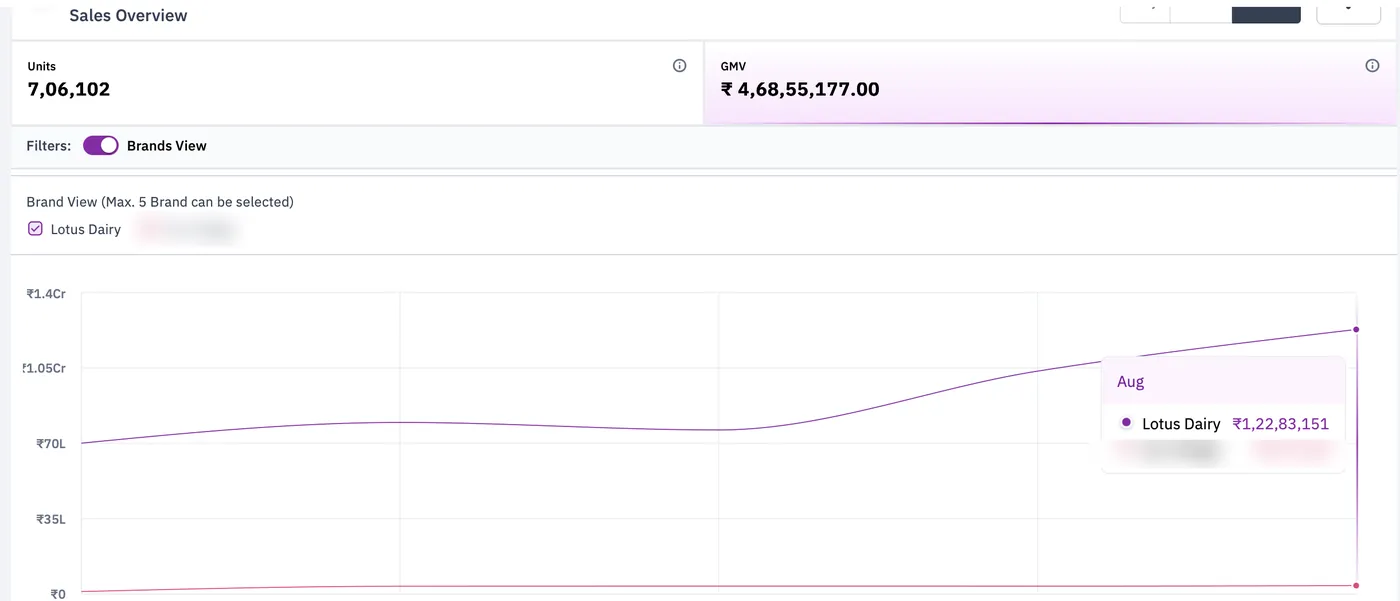
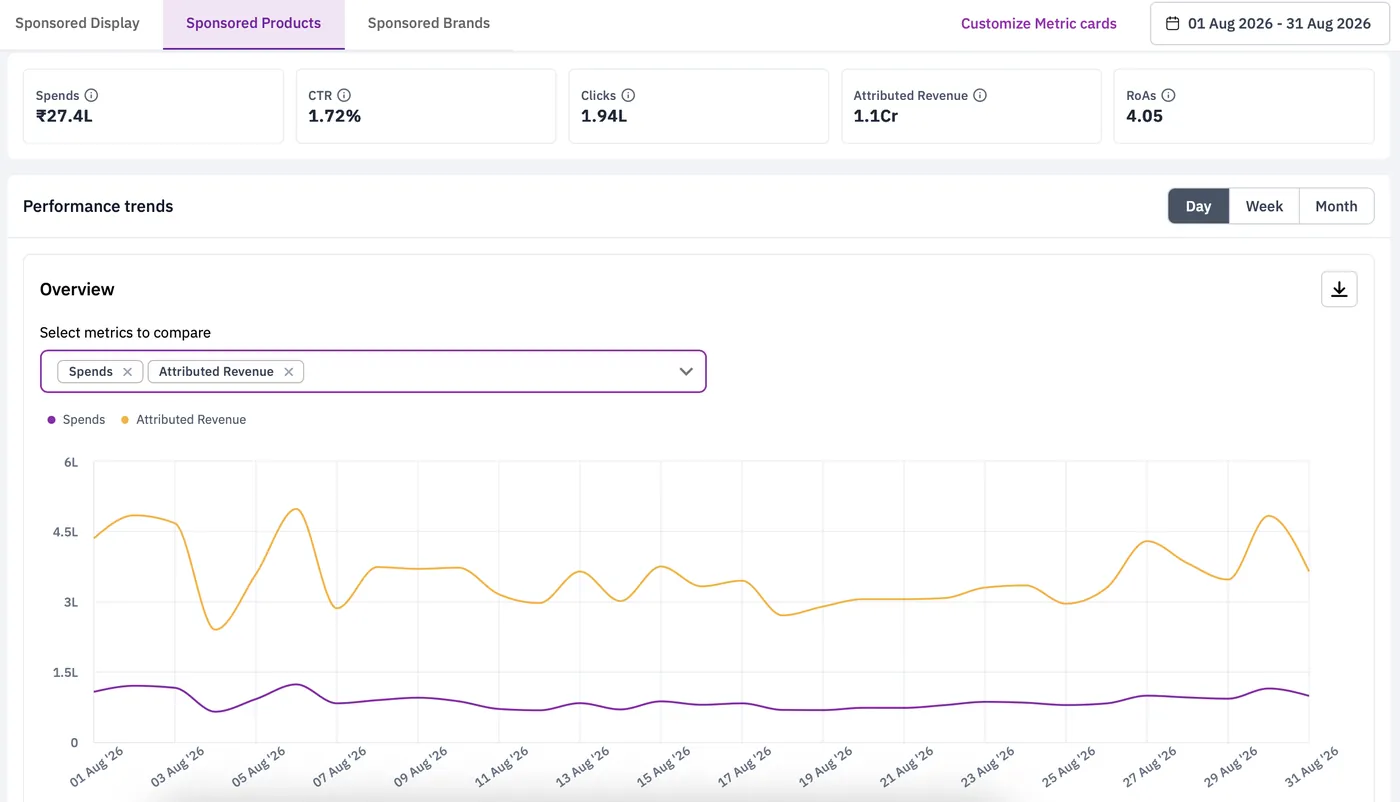
We scale quick commerce too.
Same operator approach, applied to Blinkit, Zepto, and Instamart — this is a live Q-comm dashboard, not a mockup.
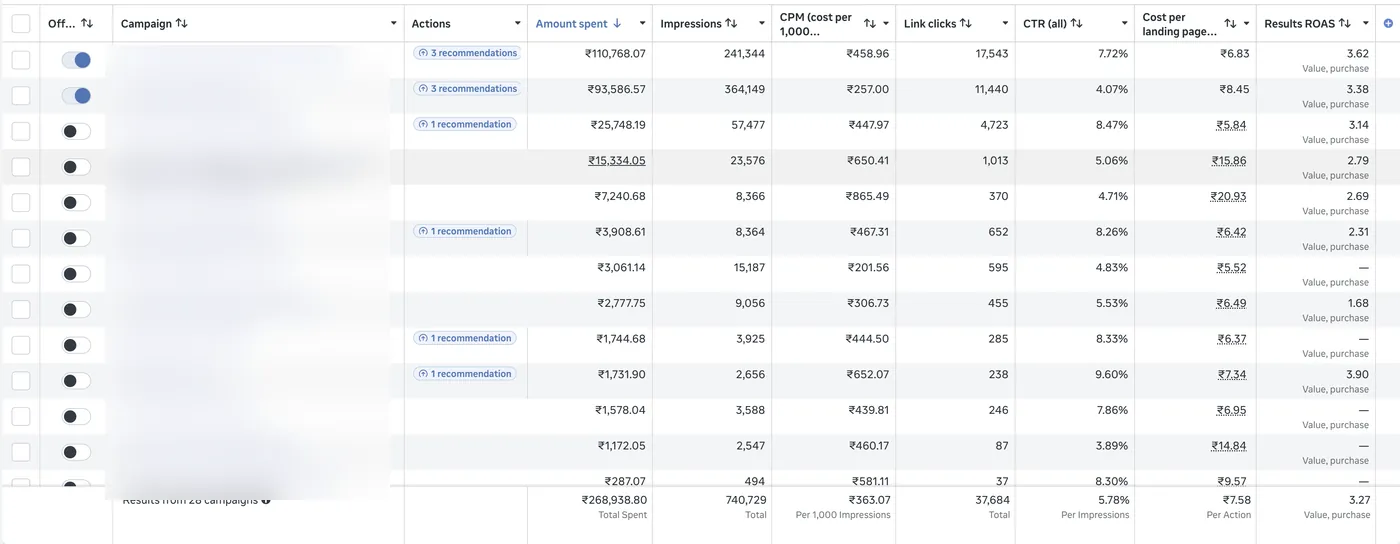
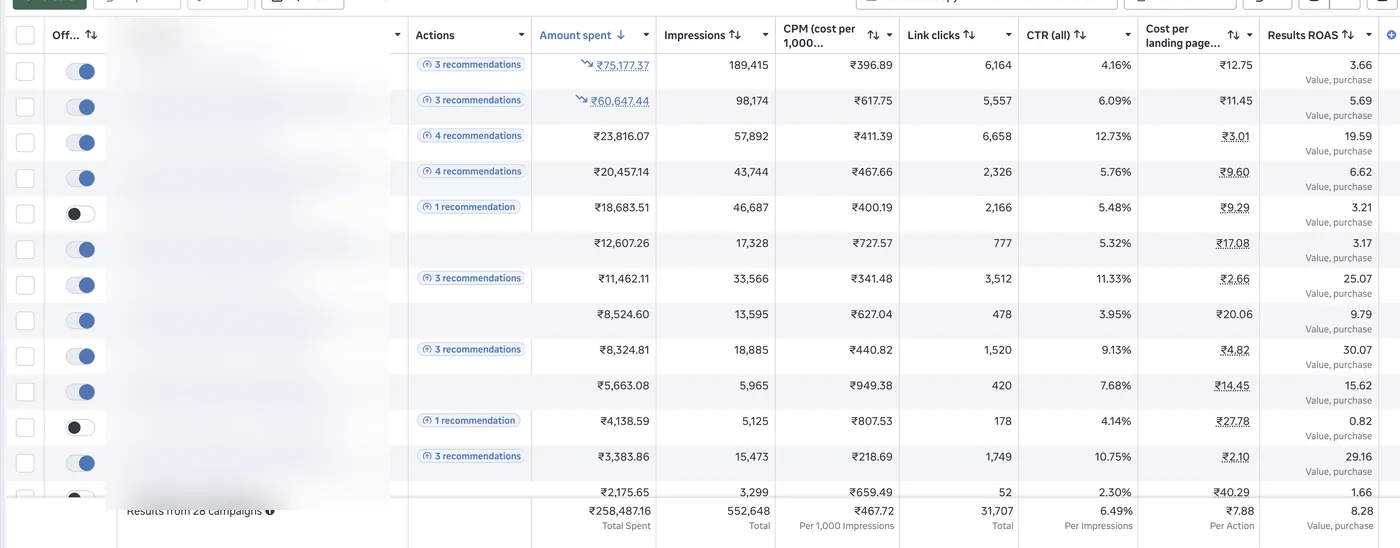
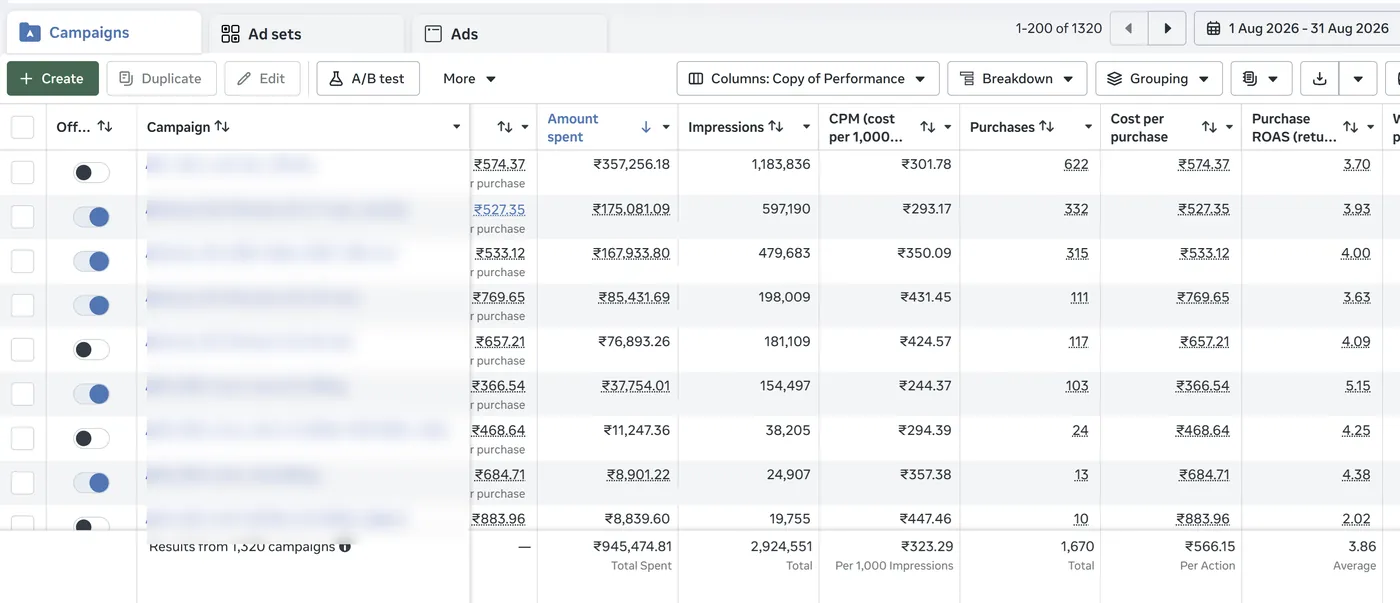
A live Meta Ads dashboard
Real spend, real ROAS, real purchases — pulled straight from an active ad account. Campaign names blurred to protect client confidentiality.
Let's see if it's a fit.
30 minutes. I'll tell you exactly what's working, what isn't, and what I'd do differently.